These graphs show how the cost of living has really changed

Inflation is expected to peak at 7.75 per cent as prices for energy and food spike. Photo: TND
The cost of living is shaping up to be a major issue at next year’s federal election, with the Opposition rolling out new policies aimed squarely at household budgets this month.
Labor most notably said its climate policy would drive down energy bills while the Coalition has been talking up its tax cuts.
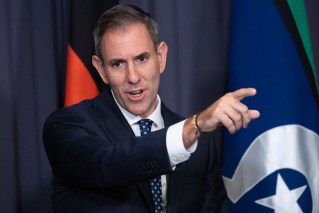
But both Prime Minister Scott Morrison and Labor leader Anthony Albanese have made dodgy claims to voters about petrol prices and power bills over the past fortnight, in attempts to paint the other party as a bad choice.
Mr Morrison falsely said petrol prices would rise if he was voted out.
And Mr Albanese said on Facebook that power bills are rising, even though electricity prices have fallen dramatically over the past year.
So, how can you know when a politician is telling the truth about the cost of living?
The latest wages and inflation data from the Australian Bureau of Statistics offers us what need to know – and The New Daily has crunched the numbers below.
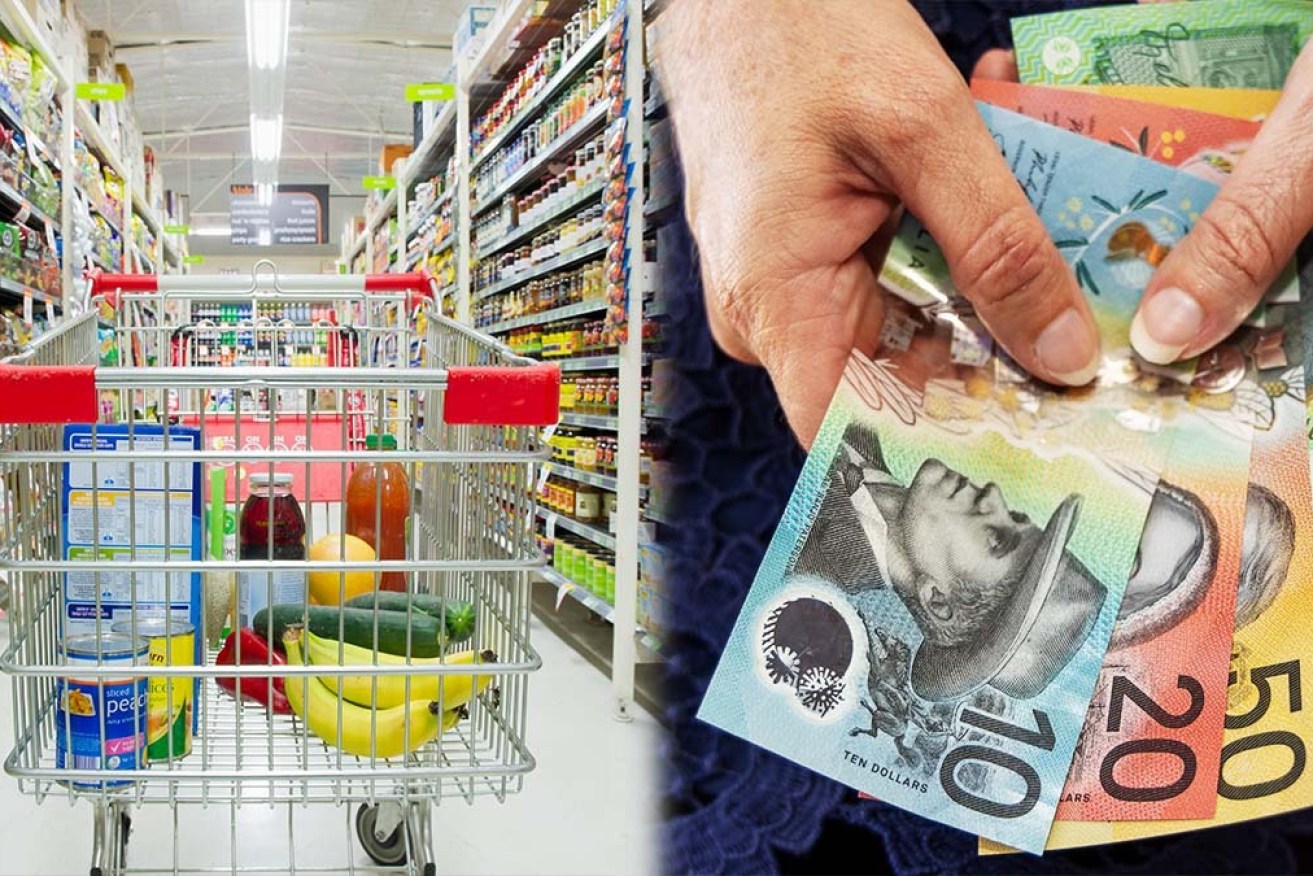
How the cost of living has really changed
One thing is clear: Living in Australia has become more expensive in real terms over the past year, and not just for one group of households.
The latest ABS data shows overall living costs rose faster than wages for all household groups in the year to September.
But the ABS wage data doesn’t capture all aspects of household income.
For example, government income support is excluded and increased substantially during the pandemic, which contributed to rising household disposable income.
This means in some cases the price rises relative to changes in household income aren’t as stark as they seem.
That said, the government’s COVID support measures have mostly ended now – leaving wages growth as the key factor offsetting rising prices heading into next year and beyond.
As for the past year, the ABS data shows 61 per cent of 100 distinct prices tracked in the Consumer Price Index (CPI) became less expensive in real terms in the 12 months to the September quarter.
But the CPI is only a broad indicator of living costs – what’s more important is whether the price of essential goods that we all must buy are going up.
For example, petrol is a significant and often unavoidable part of household budgets, so a 22.5 per cent increase in the automotive fuel category within 12 months is a huge strain on Australian motorists.
On the other side of the ledger, the 7.2 per cent fall in electricity prices over the past year has eased pressure on household energy bills.
Everyone uses electricity, so the entire country has benefitted from this.
With this in mind, let’s break the price changes down into segments, starting with food.
The story here is mixed. Although more categories of food have become cheaper in real terms, some of the increases are particularly painful.
Red meat is much more expensive in dollar terms than packaged items like cereals and jam, so smaller declines in these prices are outweighed by higher beef and veal prices – at least for households consuming meat.
Looking more broadly, it’s a similar story with goods prices.
Although more categories saw their prices fall than rise, big-ticket items such as clothing and cars shot upwards.
This means many families saw their savings on smaller items dwarfed by rising costs elsewhere.
Clothing prices fell by 3.9 per cent in the year to September, but people were also buying less clothes during lockdown.
The same can’t be said of furniture, which became 3.3 per cent more expensive over that time.
Motor vehicle prices rose 6.2 per cent, which translates to a much larger rise in dollar terms than the jump in furniture prices.
But what about the side of the economy that declined significantly during lockdown: Services?
As the above graph shows, most categories became more expensive in real terms – particularly child care, which was thrown around during the pandemic because of changes to government subsidies.
But how much control does the federal government actually have over prices in a market economy like Australia?
Economist Saul Eslake said some price changes are driven by the government, while others aren’t.
Mr Eslake said the prices of cigarettes, alcohol, child care, medicine and private health insurance are particularly sensitive to government tax and subsidy policies.
But others such as petrol prices are driven by international factors.
“Fiscal policy settings can also have some influence on the economic environment in which general prices levels are determined,” he said.
Want to see more stories from The New Daily in your Google search results?
- Click here to set The New Daily as a preferred source.
- Tick the box next to "The New Daily". That's it.

The billionaire who failed Whyalla steelworks


Carveouts for business after budget backlash